Predicting Opening Weekend Gross Earnings for the Movies
Predicting Opening Weekend Domestic Gross Earnings for the Movies
The movie industry spends millions of dollars on cast and crew on most movies in the hopes of making many more millions in gross profit. The earnings come from ticket sales in the U.S. (domestic) or internatational countries, video sales, merchandise, etc. A common indicator for a movie’s performance is the opening weekend gross earnings, which provides immediate feedback on how the movie is doing. As part of a Metis Data Science Bootcamp project, I will be exploring if budget and earnings data can be used to create a predictor for the opening weekend domestic gross earnings for movies. In short, this predictor uses the past performance of movies with the cast and crew, along with budget and number of opening theaters, to make the prediction. Such a predictor would provide immediate feedback for how well a movie is doing, for example to give time to react and increase movie attendance while the movie is still in theaters.
Web Scraping and Data
The financial information for many movies, including budget and gross earnings, is available on the website http://www.the-numbers.com/. I web scraped the information from this site using the Python library BeautifulSoup. This library can be used to retrieve and parse the HTML file for a website. The code I used to web scrape, parse, and organize the data is available in a github repository.
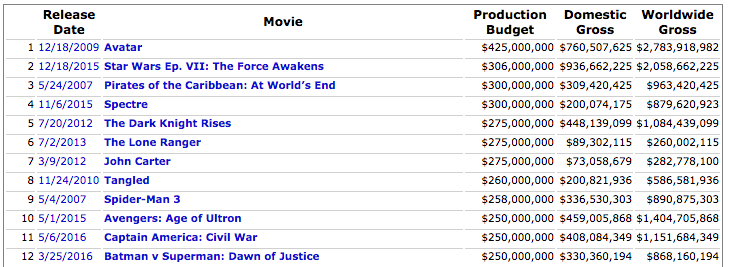
I first retrieved the list of movies for which budgets are given, and recorded the movie names, the URLs for those movies, the release date, and production budget.
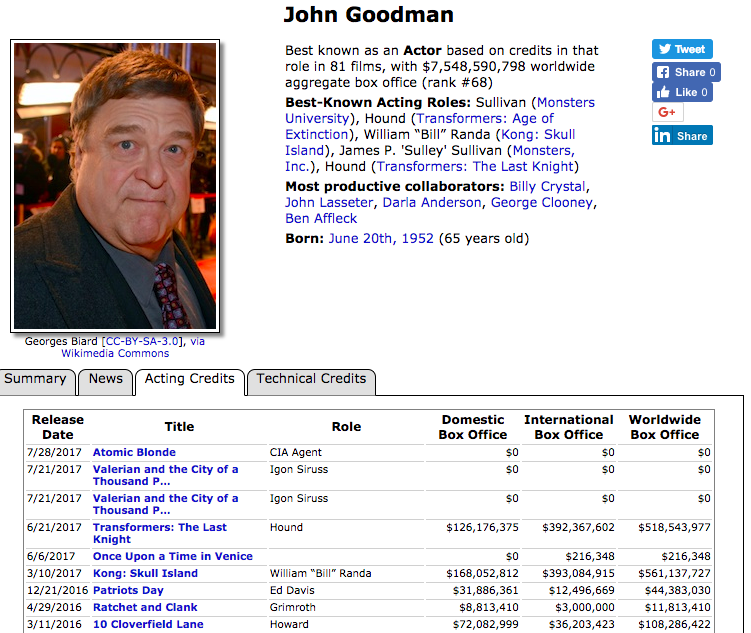
I then used the movie URLs to get a list of cast (up to 10 actors/actresses), a list of crew (including crew credits), the URLs for cast and crew members, and the opening weekend gross domestic earnings and the number of theaters the movie was playing in. On the webpage for each cast and crew member is a list of movies they’ve been in and the gross earnings for those movies.
For each of the movies in my list, I found how many movies they had been in previously, and the total gross earnings for those movies. For the crew, I found the number of movies they had done that credit and the total gross earnings of those movies. In this way, all data for the cast and crew is their historical data up to that movie. Some people have had multiple roles such as both directing and producing, but I keep the historical data separate because the success of a director is not necessarily correlated with their success as a producer.
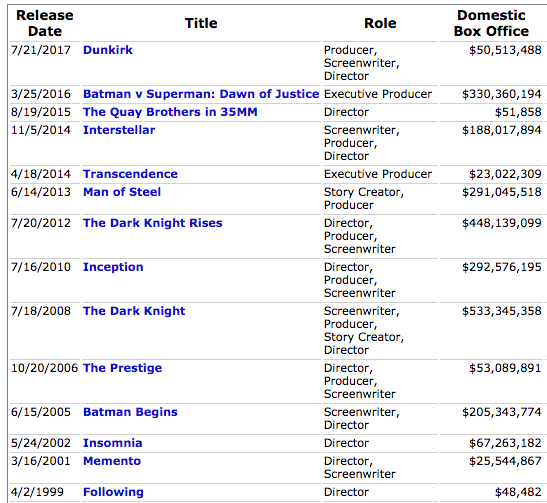
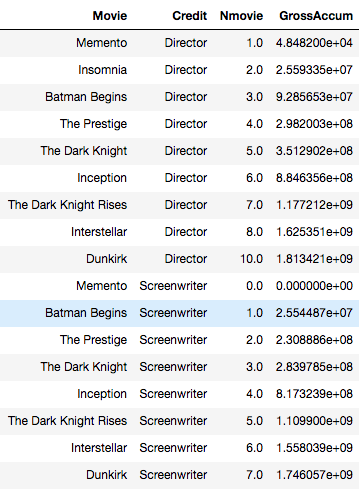
For example, refer to the partial data above for Christopher Nolan. Prior to directing Memento), he had directed one movie (Following) that had box office earnings $48,482, so that prior credit goes to Memento. But Memento was the first movie in which he was screenwriter, so he is credited 0 movies with $0 earnings as screenwriter. Then for Insomnia, the gross earnings accumulate so he is credited for directing two prior movies that had a total of gross of $48,482+$25,544,867=$25,593,349. This is repeated for all credits in the list of movies.
This process is sped up by not checking a person’s financial information more than once when they are in multiple movies in multiple roles. As I go through the actors/actresses, I check if they have had other roles for which I need information in other movies and scrape that information as well.
Number of theaters: The movie Gran Torino tarted in 6 theaters in December 2016, expanded to 84 theaters on Christmas two weeks later, then to 2,808 in the beginning of January. The movie had a total domestic gross of $148 million, but only made $271,720 its first weekend.
Trends in the Data
We can look at individual features to see if there are any obvious relationships with gross earnings.
Number of Theaters
Without looking at the data, the number of theaters a movie plays in will obviously play a large role in how much the movie will earn. Gran Torino opened in 6 theaters on the weekend of December 12, 2008 and had a total gross of $271,720. When it opened to 2,808 theaters the following January 9, it grossed $40,524,518. Clearly this is because having more theaters allows more tickets. But the gross is not necessarily linear with the number of theaters.
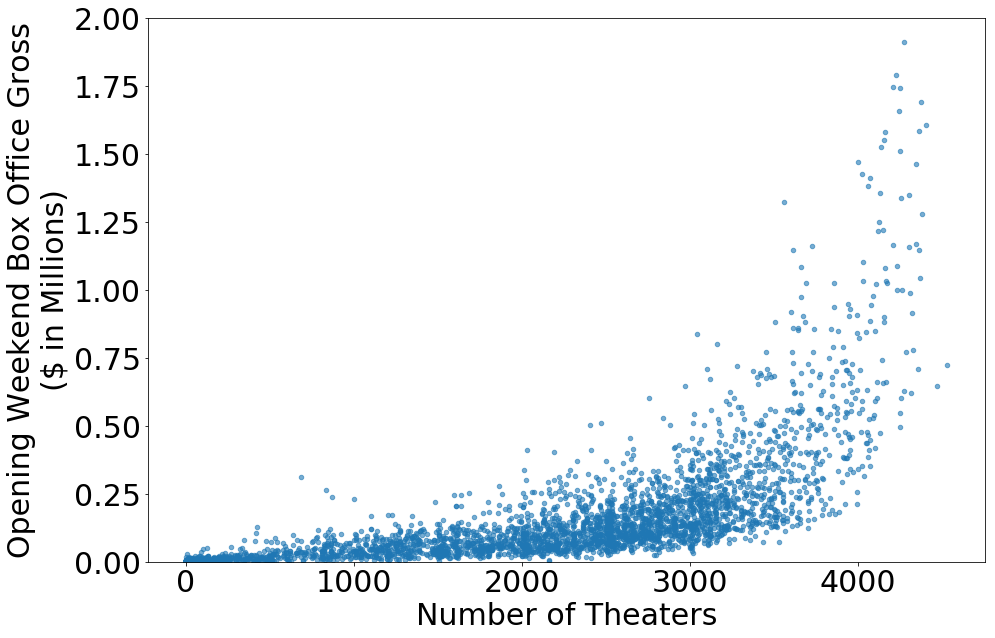
The non-linear upward curve is quite apparent, and it’s not just a second-order relationship. Here’s the same data with the number of theaters raised to the power of six:
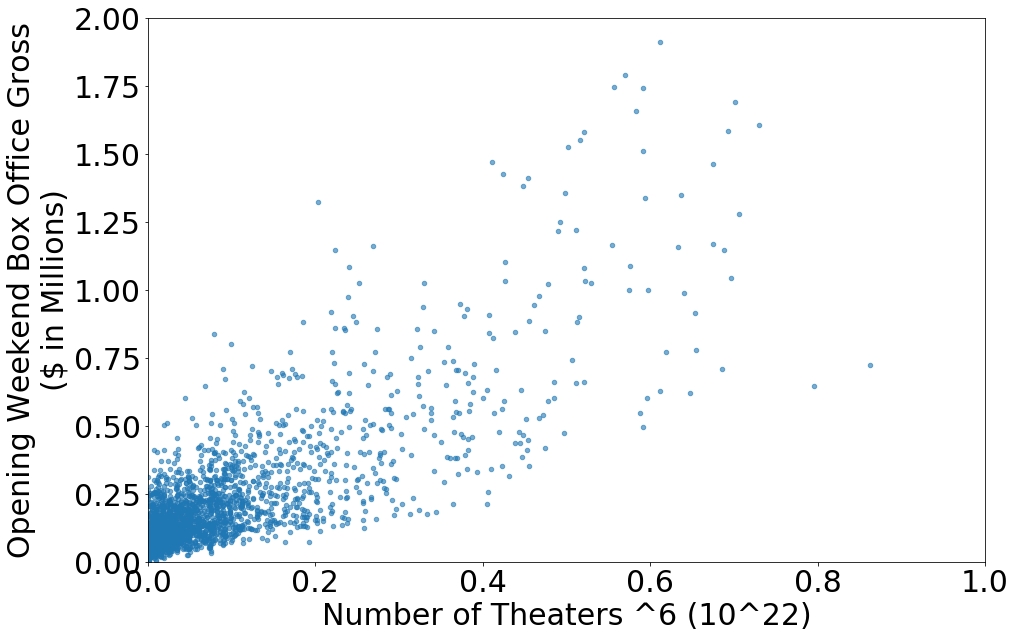
This means we should fit up to a sixth order polynomial.
Ticket sales
The total gross that a movie makes depends on the cost of a ticket. A movie that opened in 1950 naturally won’t make nearly as much as a movie that opened in 2010, even if they opened in the same number of theaters, simply because the cost of a ticket is much higher in 2010.
Here you can see the total gross of all movies for the years available on the-numbers.com, as well as total ticket sales, from 1995 to 2016.
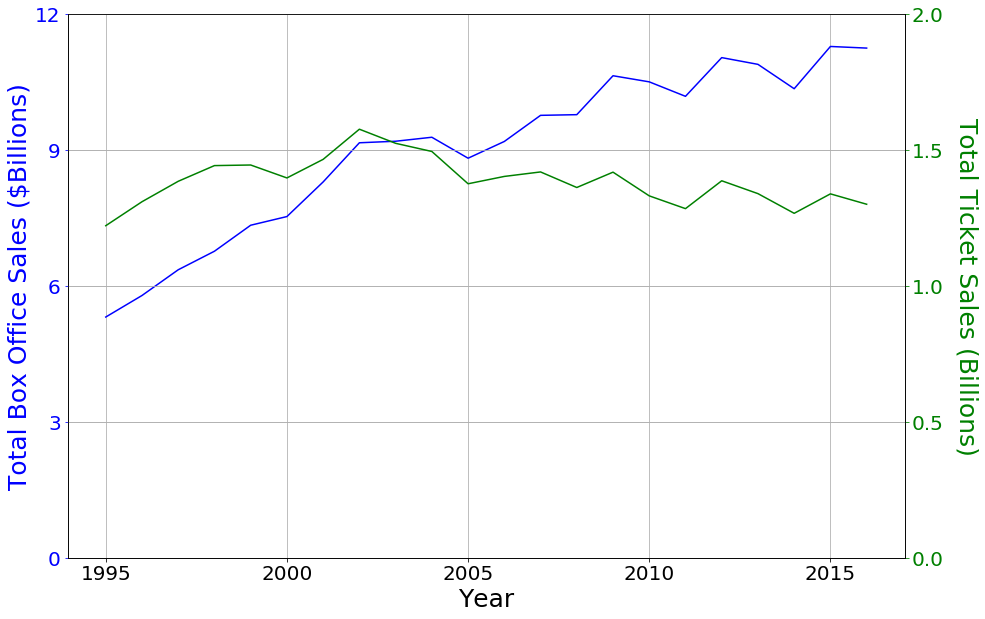
While the total number of tickets sold has stayed relatively constant, the total gross for all movies has over doubled. This indicates that the year the movie was made will strongly affect its domestic gross. However, rather than trying to use the year for our model fit, we can use the average cost per ticket as a feature.
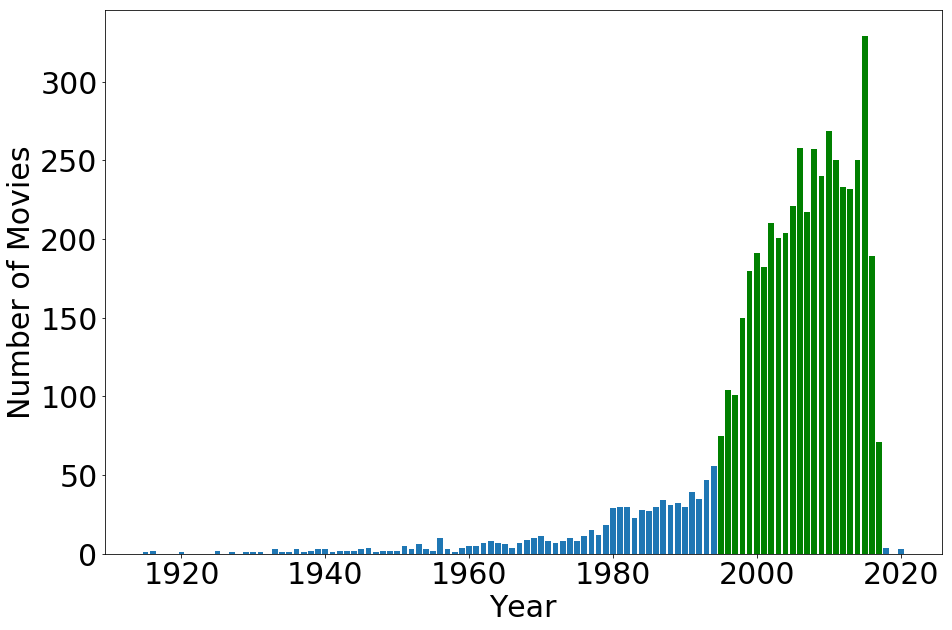
Since I only have this information from 1995 on, I will limit the movies used to only those released in 1995 and onward. Fortunately, this is a majority of the movies in the dataset. This graph shows the number of movies that have budgets per year, and the green indicates the years used in the model.
Accumulated Gross
The accumulated gross of prior movies acts as an indicator of how well the movies typically do for cast and crew members. If we plot the accumulated gross compared to the number of movies, the slope is the average gross per movie. I expected the slopes for different crew to be somewhat similar, for the slopes to increase with number of movies, and for the trends to be very noisy. However, I was surprised to see how consistent the trends were for different crew members. Below is a plot showing the accumulated gross vs. number of movies for Executive Producers.
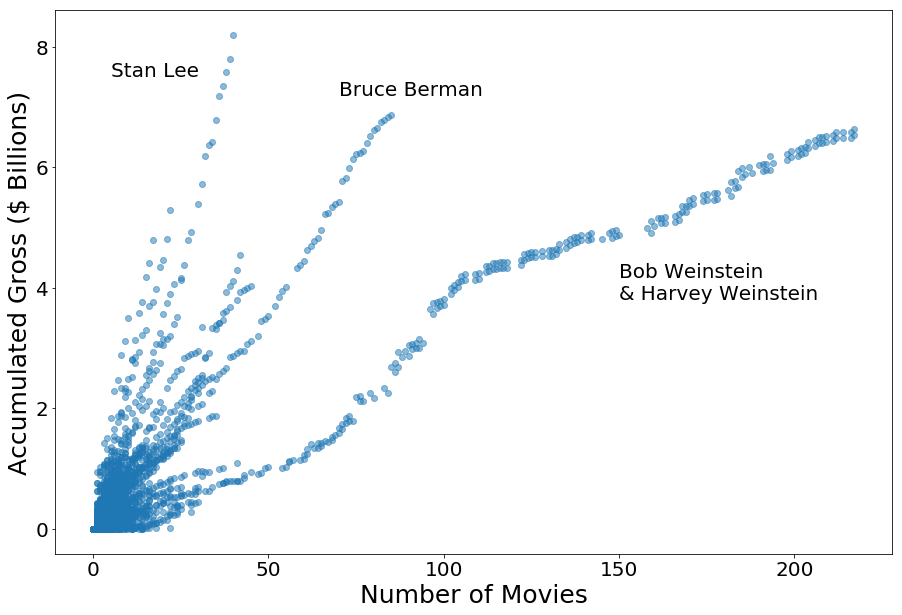
Executive Producers with a higher slope consistently have more successful movies than those with a lower slope. As Executive Producer of the Marvel movies, Stan Lee has consistently higher grossing movies. Bruce Berman’s movies don’t do as well as Stan Lee’s, but do better than the Bob and Harvey Weinstein. For the Weinstein Brothers, there are obvious changes in trend. In the first half of their movies, they’re doing increasingly well, and then something changed at around 100 movies so they haven’t done quite as well, but are more consistent. The change was that they were working for Miramax and in 2005 (at about 100 movies) they left to form The Weinstein Company.
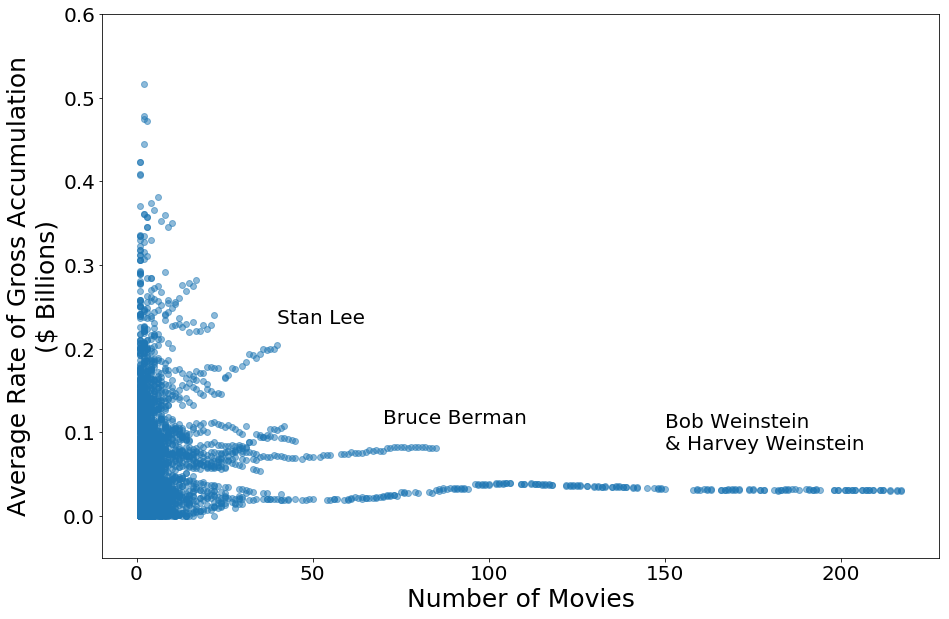
This means the succeess of a crew member’s movie doesn’t necessarily change with number of movies. We can thus try to use the average gross of the previous movies as an estimator for how their current movie will do. Below is the average gross of prior movies relative to number of movies.
Regularization
Regularization does a fit to the data while minimizing the complexity of the model needed to get a best fit. It does this by finding the minimum loss through gradient descent, but with an added penalty to the weights used on the different features used. In this way, if a feature does not have a large effect, its weighting will decrease to make the model less complicated to prevent overfitting. Lasso is a form of regularization where the cost function is found by
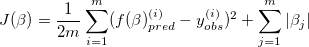
The tuning parameter \lambda is chosen based on how much penalty should be given for the weights. If lambda is small, the model won’t be penalized as much for having larger weights. As lambda gets larger, more penalty will be given for having more features, so the weights will be decreased as long as it doesn’t greatly affect the model fit. This will leave behind only the most important features. Ridge and ElasticNet are other regularizations that can be used, but I found that Lasso worked better for this data set.
When doing regularization, standardization of the data makes it so the tuning parameter equally affects the different weights. If the data isn’t standardized, some feature weights will be very large while others are small, so the larger weights would be penalized more simply because they are larger rather than based on their importance.
The Model Results
I used a second-order polynomial fit that was made to the data using a scikit-learn pipeline, and the model had an R^2 value of 0.87. Here you can see the comparison of the predicted values vs. the actual opening weekend gross:
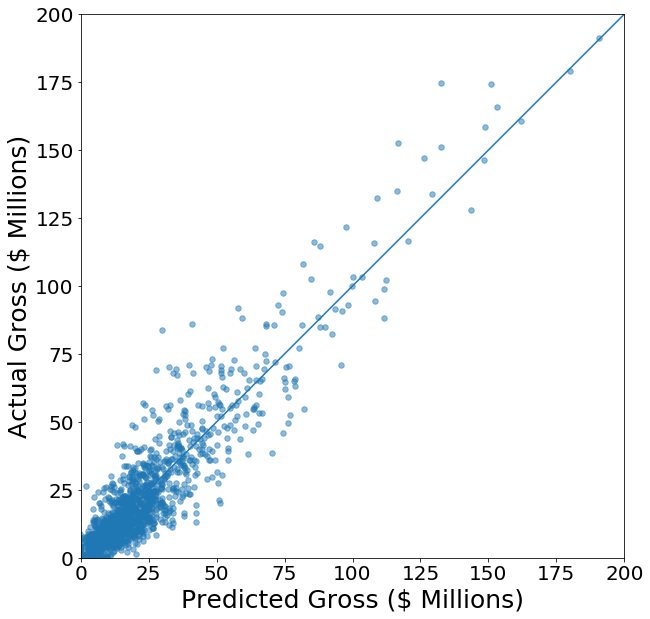
The solid line shows where the model and actual values would be the same. If a point is above the line, the movie did better than predicted. Here is a histogram of the residuals:
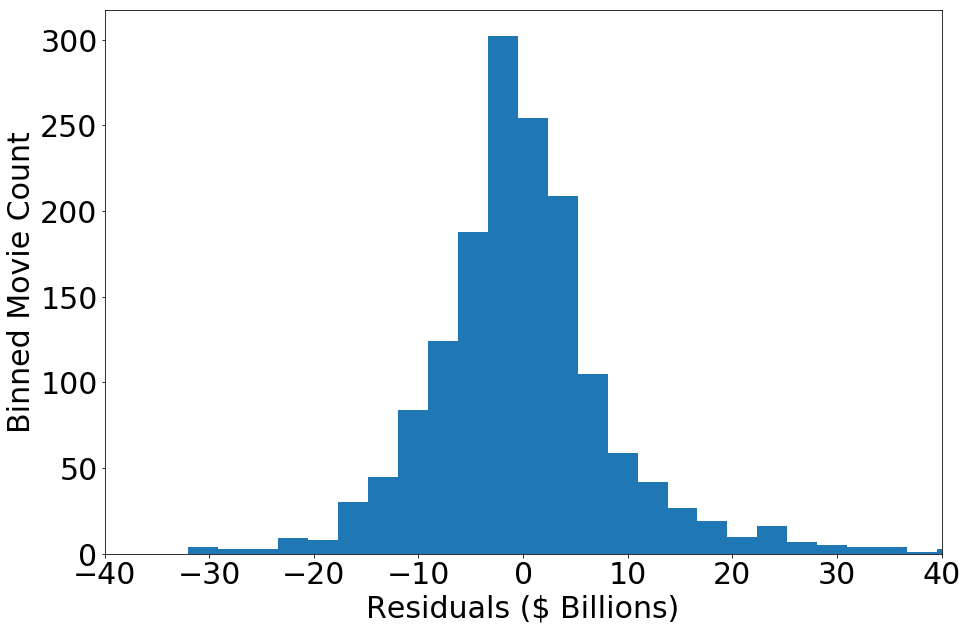
The residuals have a standard deviation of $9 million. It also has a moderate amount of positive skew (0.84), which is not surprising as the greatest outliers tended to be higher (box office hits showed greater difference from prediction than flops). The kurtosis is also moderately high (3.5), although this could be because this model is being fit to values that have a large range and a lower-bound of zero, resulting in a heteroskedacity in the prediction error (higher values have greater error). To check for this, I plotted the residuals for each movie in order of the movie’s gross (plotting the residuals vs. gross or log(gross) was not as clear given the scale of the data):
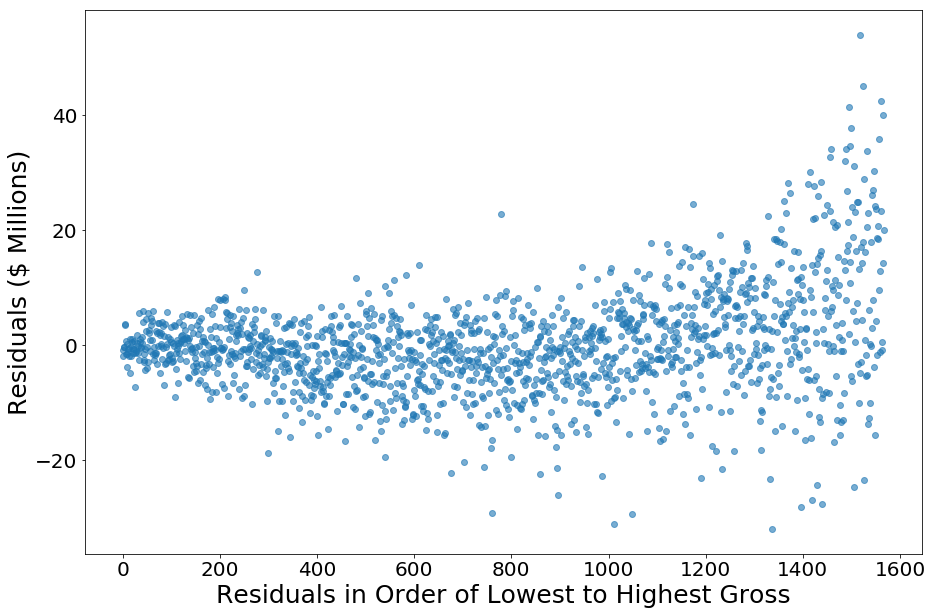
It can be seen the lower grossing models are better predicted as expected, and the movies with higher gross had more error and tended to be higher than expected. The residuals had a standard deviation of $6 million for movies that grossed $20 million or less (the first ~1000 movies, 64% of the movies).
This model could be used to make a predition for the opening weekend domestic gross of movies given the who is in the cast, crew, and the number of theaters it is opening in. This would act as an early indicator if a movie’s gross is lower than expected, providing time to increase advertisement or make intervention decisions immediately after release.